

Analysis of the Risk-Funding Decision
THE RHA REVIEW
Volume 3, No. 1, Fourth Quarter 1996
By Amy V. Puelz, Ph.D.
All firms are faced with making the decision about how to design a funding plan for property-liability risks. On a regular basis, managers should reevaluate their risk management plan and determine whether current self-insurance funding and/or commercial coverage is appropriate, given the firm’s financial position, its existing risk exposure and the prevailing economic climate. Managers should have a clear understanding of how much risk is retained by the firm in the form of deductibles, coverage caps and self-insurance plans, and should be able to justify the reasonableness of risk-retention decisions to stakeholders.
There are a number of decision-analysis tools that can assist managers in risk-funding evaluations. However, because of the complex nature of the problem, a simulation technique lends itself best to the analysis. A description of the cost and risk for each plan is derived by "simulating" the cost of risk funding for the many possible random outcomes. From this analysis, the expected cost and risk associated with different funding plans can be derived and compared with other plans. The random components of the loss-cost estimation are the number of losses and the severity of an individual loss. The random components of the financing-cost estimation are the rate at which claims are paid, the interest rate earned on surplus reserve funds and the interest rate paid when a fund deficit occurs.
To illustrate the use of simulation in the risk-funding decision, consider a hypothetical firm with three risk-funding options: (1) to purchase conventional insurance with a $100-per-loss deductible, (2) to purchase conventional insurance with a $500-per-loss deductible or (3) to self-insure all risk. Assume that the expected number of losses for this hypothetical firm is 200 per year and that the expected loss severity is $1,000-per-loss. The simulation cost analysis shown accounts for the fact that claim payments for a given accident year are typically spread out over several years and that interest rates for borrowing and investing funds over this payout period follow a "random walk" pattern. The current economic climate is incorporated in the model interest rates by setting the drift and variability factors to reflect market expectations.
Assume our hypothetical firm has $162,000 set aside in a fund for its annual risk-related costs. This fund is used to pay premiums for conventional insurance and any deductible costs. In the self-insurance plan, the fund is used to pay all loss costs. The risk-related cost to our firm was evaluated over 500 random outcomes. The histograms in Figures 1, 2 and 3 summarize these 500 random outcomes as the value in the fund after all risk-related costs for the year have been paid.

Figure 1 illustrates the ending fund value if the conventional insurance plan with a $100-per-loss deductible is selected. This is the plan in which the firm has shifted most of the risk exposure to the insurance company. The expected ending value of the fund is $1,910, with a worst-case minimum value of -$2,390 and a best-case maximum value of $5,680. There is a small probability (less than 10%) that the ending value of the insurance fund will be negative. In other words, there is less than a 10% chance that the fund will not be sufficient to finance losses.

Figure 2 illustrates the ending fund value if the conventional insurance plan with a $500-per-loss deductible is selected. In this case the firm is retaining more of the risk, which is evident in a greater range of potential outcomes, from -$14,350 to $21,280. The expected ending fund value at $6,880 is higher than that for the $100-deductible plan, but the potential for a negative ending fund balance is greater, at 15%.
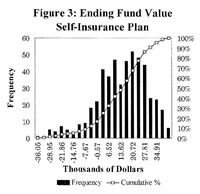
The third self-insurance plan is illustrated in Figure 3. In this case, in which all risk is retained by the firm, the expected ending fund value is the highest, at $12,500. However, the variability of the ending fund value is much greater than the other plans, ranging from -$36,000 to $42,000. The probability of ending with a negative fund value is about 17%.
Based on the simulation analysis, management of our hypothetical firm must compare the cost versus risk of these three risk-funding alternatives and determine which is most in line with the firms risk-tolerance levels. In general, by using simulation analysis to evaluate the risk-funding decision, management will have a better understanding of the true cost of its risk plan in terms of not only the cost of conventional insurance but also the cost of retained risk.